Cremi example#
This example shows how to use volara to process a realistic dataset. In this case we are using CREMI. We used volara to generate the predictions blockwise. To see how to use volara to generate predictions blockwise, see the volara-torch plugin example
[1]:
import multiprocessing as mp

mp.set_start_method("fork", force=True)  # type: ignore[call-arg]
[2]:
import logging
from pathlib import Path

from funlib.geometry import Coordinate

logging.basicConfig(level=logging.WARNING)

Path("_static/cremi").mkdir(parents=True, exist_ok=True)
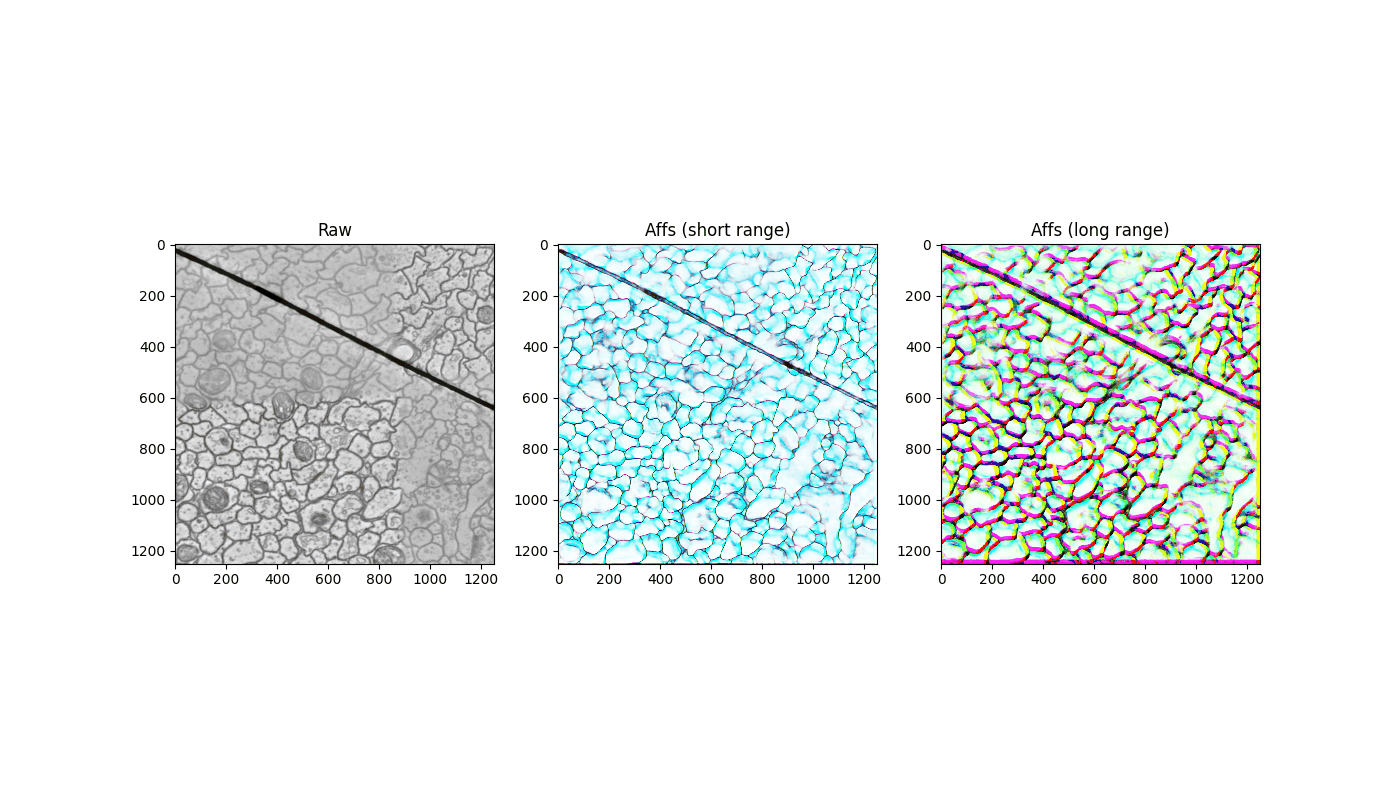
First things first lets visualize the data we’ve been given.
[3]:
import matplotlib.animation as animation
import matplotlib.pyplot as plt

from volara.datasets import Affs, Raw

raw = Raw(store="sample_A+_20160601.zarr/raw", scale_shift=(1 / 255, 0))  # type: ignore[arg-type]
affs = Affs(store="sample_A+_20160601.zarr/affs")  # type: ignore[arg-type]

fig, axes = plt.subplots(1, 3, figsize=(14, 8))

ims = []
for i, (raw_slice, affs_slice) in enumerate(
    zip(raw.array("r")[:], affs.array("r")[:].transpose([1, 0, 2, 3]))
):
    # Show the raw data
    if i == 0:
        im_raw = axes[0].imshow(raw_slice, cmap="gray")
        axes[0].set_title("Raw")
        im_affs_short = axes[1].imshow(
            affs_slice[0:3].transpose([1, 2, 0]), vmin=0, vmax=255, interpolation="none"
        )
        axes[1].set_title("Affs (short range)")
        im_affs_long = axes[2].imshow(
            affs_slice[[0, 5, 6]].transpose([1, 2, 0]),
            vmin=0,
            vmax=255,
            interpolation="none",
        )
        axes[2].set_title("Affs (long range)")
    else:
        im_raw = axes[0].imshow(raw_slice, cmap="gray", animated=True)
        axes[0].set_title("Raw")
        im_affs_short = axes[1].imshow(
            affs_slice[0:3].transpose([1, 2, 0]),
            vmin=0,
            vmax=255,
            interpolation="none",
            animated=True,
        )
        axes[1].set_title("Affs (short range)")
        im_affs_long = axes[2].imshow(
            affs_slice[[0, 5, 6]].transpose([1, 2, 0]),
            vmin=0,
            vmax=255,
            interpolation="none",
            animated=True,
        )
        axes[2].set_title("Affs (long range)")
    ims.append([im_raw, im_affs_short, im_affs_long])

ims = ims + ims[::-1]
ani = animation.ArtistAnimation(fig, ims, blit=True)
ani.save("_static/cremi/inputs.gif", writer="pillow", fps=10)
plt.close()
Now we can convert the results to a segmentation. We will run mutex watershed on the affinities in a multi step process.
Local fragment extraction - This step runs blockwise and generates fragments from the affinities. For each fragment we save a node in a graph with attributes such as its spatial position and size.
Edge extraction - This step runs blockwise and computes mean affinities between fragments, adding edges to the fragment graph.
Graph Mutex Watershed - This step runs on the fragment graph, and creates a lookup table from fragment id -> segment id.
Relabel fragments - This step runs blockwise and creates the final segmentation.
[4]:
from volara.blockwise import AffAgglom, ExtractFrags, GraphMWS, Relabel
from volara.datasets import Labels
from volara.dbs import SQLite
from volara.lut import LUT
First lets define the graph and arrays we are going to use.
because our graph is in an sql database, we need to define a schema with column names and types for node and edge attributes. For nodes: The defaults such as “id”, “position”, and “size” are already defined so we only need to define the additional attributes, in this case we have no additional node attributes. For edges: The defaults such as “id”, “u”, “v” are already defined, so we are only adding the additional attributes “xy_aff”, “z_aff”, and “lr_aff” for saving the mean affinities between fragments.
[5]:
fragments_graph = SQLite(
    path="sample_A+_20160601.zarr/fragments.db",  # type: ignore[arg-type]
    edge_attrs={"xy_aff": "float", "z_aff": "float", "lr_aff": "float"},
)
fragments_dataset = Labels(store="sample_A+_20160601.zarr/fragments")  # type: ignore[arg-type]
segments_dataset = Labels(store="sample_A+_20160601.zarr/segments")  # type: ignore[arg-type]
Now we define the tasks with the parameters we want to use.
[6]:
block_size = raw.array("r")._source_data.chunks

# Generate fragments in blocks
extract_frags = ExtractFrags(
    db=fragments_graph,
    affs_data=affs,
    frags_data=fragments_dataset,
    block_size=block_size,
    context=Coordinate(6, 12, 12),
    bias=[-0.6] + [-0.4] * 2 + [-0.6] * 2 + [-0.8] * 2,
    strides=(
        [Coordinate(1, 1, 1)] * 3
        + [Coordinate(1, 3, 3)] * 2  # We use larger strides for larger affinities
        + [Coordinate(1, 6, 6)] * 2  # This is to avoid excessive splitting
    ),
    randomized_strides=True,  # converts strides to probabilities of sampling affinities (1/prod(stride))
    remove_debris=64,  # remove excessively small fragments
    num_workers=4,
)

# Generate agglomerated edge scores between fragments via mean affinity accross all edges connecting two fragments
aff_agglom = AffAgglom(
    db=fragments_graph,
    affs_data=affs,
    frags_data=fragments_dataset,
    block_size=block_size,
    context=Coordinate(3, 6, 6) * 1,
    scores={
        "z_aff": affs.neighborhood[0:1],
        "xy_aff": affs.neighborhood[1:3],
        "lr_aff": affs.neighborhood[3:],
    },
    num_workers=4,
)

# Run mutex watershed again, this time on the fragment graph with agglomerated edges
# instead of the voxel graph of affinities
lut = LUT(path="sample_A+_20160601.zarr/lut.npz")  # type: ignore[arg-type]
total_roi = raw.array("r").roi
graph_mws = GraphMWS(
    db=fragments_graph,
    lut=lut,
    weights={"xy_aff": (1, -0.4), "z_aff": (1, -0.6), "lr_aff": (1, -0.6)},
    roi=total_roi,
)

# Relabel the fragments into segments
relabel = Relabel(
    lut=lut,
    frags_data=fragments_dataset,
    seg_data=segments_dataset,
    block_size=block_size,
    num_workers=4,
)

pipeline = extract_frags + aff_agglom + graph_mws + relabel
pipeline.run_blockwise(multiprocessing=True)
Execution Summary
-----------------

  Task fragments-extract-frags:

    num blocks : 128
    completed ✔: 128 (skipped 0)
    failed    ✗: 0
    orphaned  ∅: 0

    all blocks processed successfully

  Task fragments-aff-agglom:

    num blocks : 128
    completed ✔: 128 (skipped 0)
    failed    ✗: 0
    orphaned  ∅: 0

    all blocks processed successfully

  Task lut-graph-mws:

    num blocks : 1
    completed ✔: 1 (skipped 0)
    failed    ✗: 0
    orphaned  ∅: 0

    all blocks processed successfully

  Task segments-relabel:

    num blocks : 128
    completed ✔: 128 (skipped 0)
    failed    ✗: 0
    orphaned  ∅: 0

    all blocks processed successfully
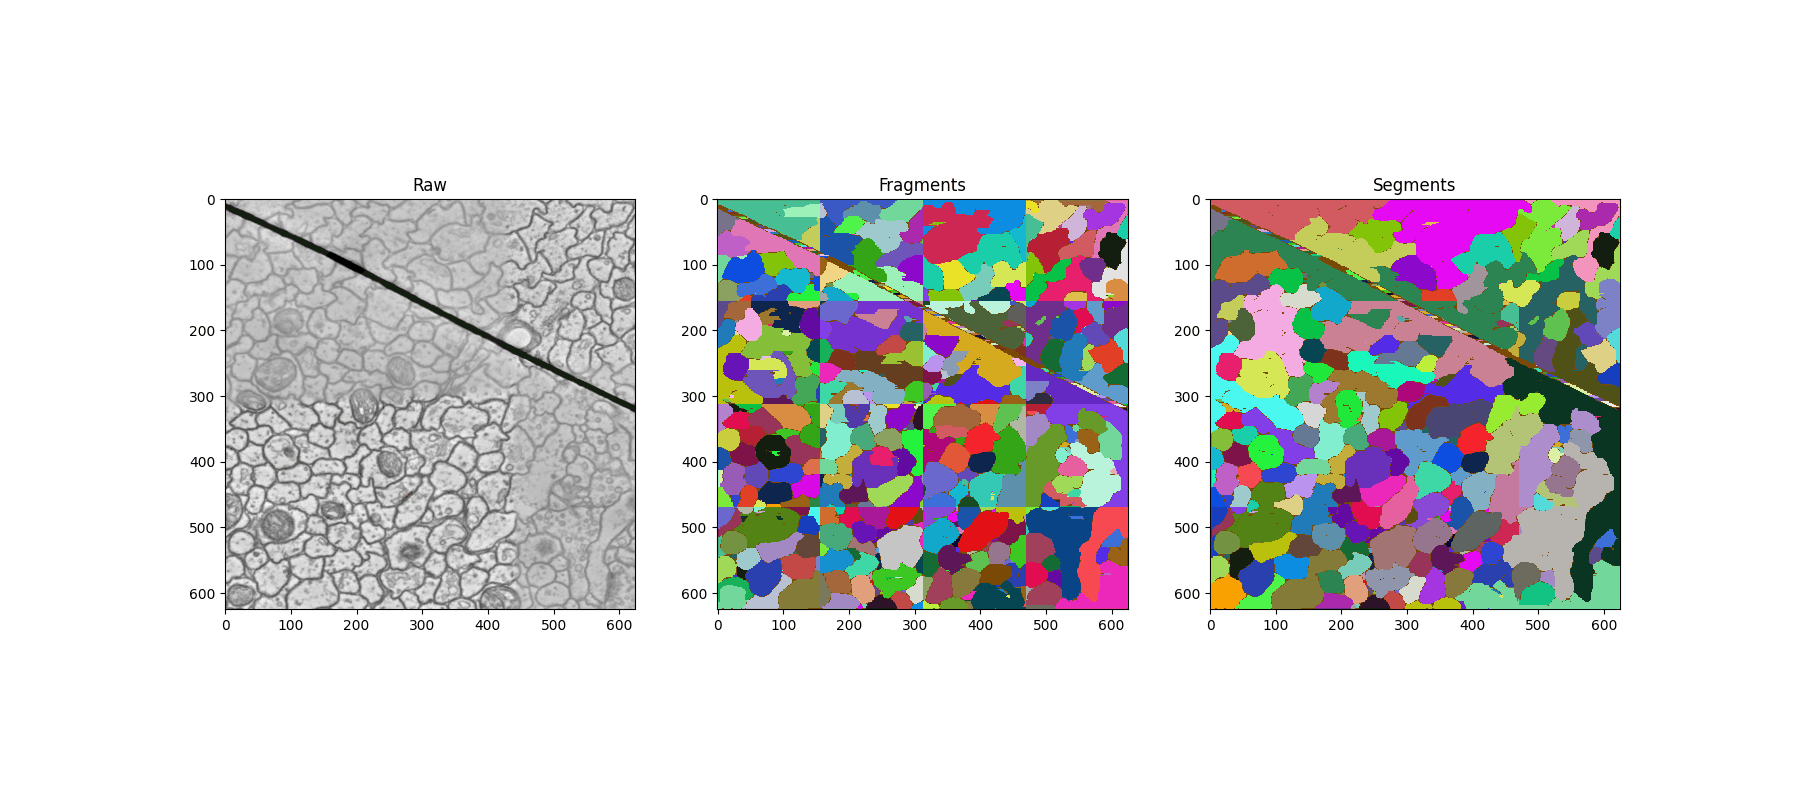
Let’s visualize
If you are following through on your own, I highly recommend installing funlib.show.neuroglancer, and running the command line tool via neuroglancer -d sample_A+_20160601.zarr/* to visualize the results in neuroglancer.
For the purposes of visualizing here, we will make a simple gif
[7]:
import matplotlib.animation as animation
import matplotlib.pyplot as plt
import numpy as np
from matplotlib.colors import ListedColormap

fragments = fragments_dataset.array("r")[:, ::2, ::2]
segments = segments_dataset.array("r")[:, ::2, ::2]
raw_data = raw.array("r")[:, ::2, ::2]

# Get unique labels
unique_labels = set(np.unique(fragments)) | set(np.unique(segments))
num_labels = len(unique_labels)


def random_color(label):
    rs = np.random.RandomState(np.random.MT19937(np.random.SeedSequence(label)))
    return np.array((rs.random(), rs.random(), rs.random()))


# Generate random colors for each label
random_fragment_colors = [random_color(label) for label in range(num_labels)]

# Create a colormap
cmap_labels = ListedColormap(random_fragment_colors)

# Map labels to indices for the colormap
label_to_index = {label: i for i, label in enumerate(unique_labels)}
indexed_fragments = np.vectorize(label_to_index.get)(fragments)
indexed_segments = np.vectorize(label_to_index.get)(segments)

fig, axes = plt.subplots(1, 3, figsize=(18, 8))

ims = []
for i, (raw_slice, fragments_slice, segments_slice) in enumerate(
    zip(raw_data, indexed_fragments, indexed_segments)
):
    # Show the raw data
    if i == 0:
        im_raw = axes[0].imshow(raw_slice, cmap="gray")
        axes[0].set_title("Raw")
        im_fragments = axes[1].imshow(
            fragments_slice,
            cmap=cmap_labels,
            vmin=0,
            vmax=num_labels,
            interpolation="none",
        )
        axes[1].set_title("Fragments")
        im_segments = axes[2].imshow(
            segments_slice,
            cmap=cmap_labels,
            vmin=0,
            vmax=num_labels,
            interpolation="none",
        )
        axes[2].set_title("Segments")
    else:
        im_raw = axes[0].imshow(raw_slice, animated=True, cmap="gray")
        im_fragments = axes[1].imshow(
            fragments_slice,
            cmap=cmap_labels,
            vmin=0,
            vmax=num_labels,
            interpolation="none",
            animated=True,
        )
        im_segments = axes[2].imshow(
            segments_slice,
            cmap=cmap_labels,
            vmin=0,
            vmax=num_labels,
            interpolation="none",
            animated=True,
        )
    ims.append([im_raw, im_fragments, im_segments])

ims = ims + ims[::-1]
ani = animation.ArtistAnimation(fig, ims, blit=True)
ani.save("_static/cremi/segmentation.gif", writer="pillow", fps=10)
plt.close()
The final segmentation is shown below. Obviously this is not a great segmentation, but it is reasonably good for a model small enough to process a CREMI dataset in 20 minutes on a github action.